2023 NHL Playoff Predictions
Who will win this year’s cup?

If you scroll down the pitching leaders page at Fangraphs today, most of the top names are not so surprising, but one unexpected name is Lance Lynn. Currently, Lynn is tied for 3rd overall with 2.9 fWAR. Historically, Lynn has been a consistent pitcher, a 2-3 WAR guy who can eat innings, but he’s hardly the type of character you would expect to break out. He’s currently in his age 32 season, putting him on the wrong side of the starting pitcher aging curve, and post Tommy John surgery, which he underwent at the end of 2015.
If you look longer at Lynn’s row on the pitching leaderboard, something else might catch your eye - he’s managed this while having a 4.40 ERA. This is symptomatic of fWAR being calculated using his FIP, which is considerably better at 3.03, meaning the Rangers defense is costing him more than a run per 9 innings. This is further highlighted in his BABIP, suffering from a career-worst at .349, where league average this year is .292. In fact, his FIP is a full point lower than his own career average, indicating that there has been some significant, true improvement this year. To evaluate this season against his prior production, I took a look at Lynn’s IP per WAR:
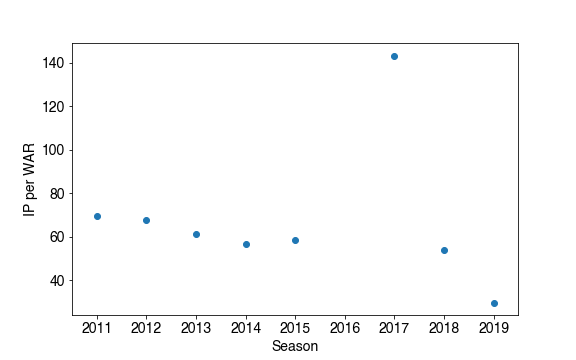
Already this plot is a bit surprising, the expectation for such a distribution would be to follow a typical aging curve, but, excluding the outlier, Lynn seems to be continuing to improve. If you do drop off the outlier and remove his missed year for Tommy John surgery, a linear regression does quite well in describing his improvement year-to-year:
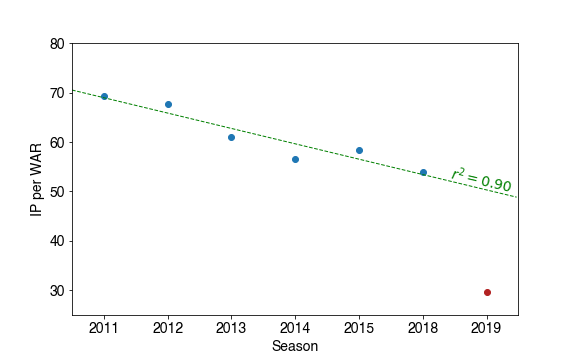
But this trend has broken down in 2019. Following the linear trend, you might expect him to be worth a win every 50 IP. If you were realistic and evaluated this against an aging curve, you might expect worse than that. Instead, he’s been worth a win every 30 innings pitched, something nobody would have expected walking into this season.
Lynn started a 3-year, $30M contract with the Rangers this year, so it’s possible you can contribute some of this to pitching against different opponents, but for a change this significant, I went on to look into if there were any major smoking guns to indicate a change in approach.
If you know anything about Lance Lynn, you know that he likes fastballs. I mean, he really likes fastballs. On June 2, 2015, Lynn threw 118 pitches in a 1-0 win over the Brewers. Of those, 117 were fastballs. On being asked what the other was, he replied “It was an out, who cares?” Following this start, in one of my favorite postgame interviews of all time, while joking with the media, he foreshadows talking about secondary pitches “…it’s part of evolving as a pitcher, you never know when you get older and might need some other pitches, so why not work on them now?”
In fact, that’s the most notable change in his approach this year. Lynn’s 4 and 2-seam fastball usage (FB%) is significantly down from prior years, to 69.0%, 8.0% lower than his career average. Taking a look at his total pitch composition:
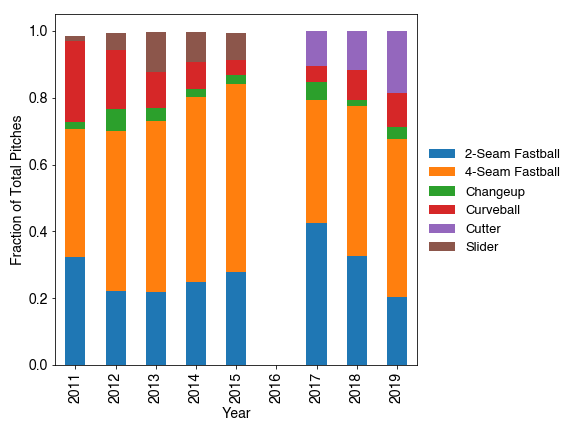
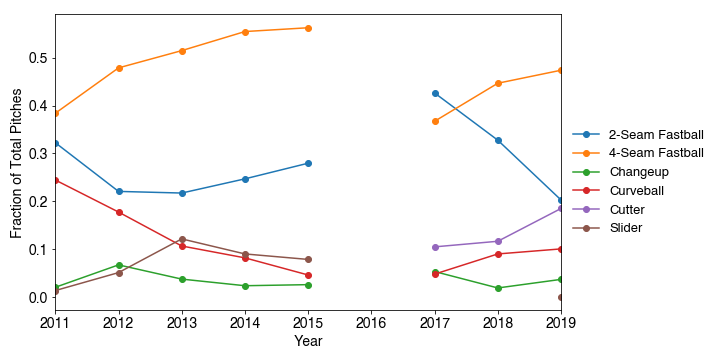
While his fastball usage has decreased in aggregate, it’s really that he’s scaled back his 2-seam usage significantly. He’s actually increased his 4-seam usage and is getting more and more comfortable with his cutter, increasing throwing it 6.5% more than last year. So there’s a notable change in pitch selection.
To investigate if his improvement this year is a result of this change in pitch selection, I looked at the results of each pitch type. Over the course of his career, his cutter is thrown for strikes 3.5% more than his 2-seam fastball, and his 4-seamer is thrown for 3.8% more strikes than the 2-seamer. Furthermore, these pitches result in fewer balls in play: 4.3% fewer by the 4-seamer, 2.0% fewer by the cutter compared to the 2-seamer. So, the outcomes of these pitches do seem to be slightly more favorable, and in a game of large sample sizes, these percent-level improvements matter.
One other interesting check is Lynn’s usage of each pitch based on the count. For this, I compared the rate he uses each pitch, subtracting his rate prior to 2019 from his usage so far this season. This table shows the change for 2019 vs previous years:
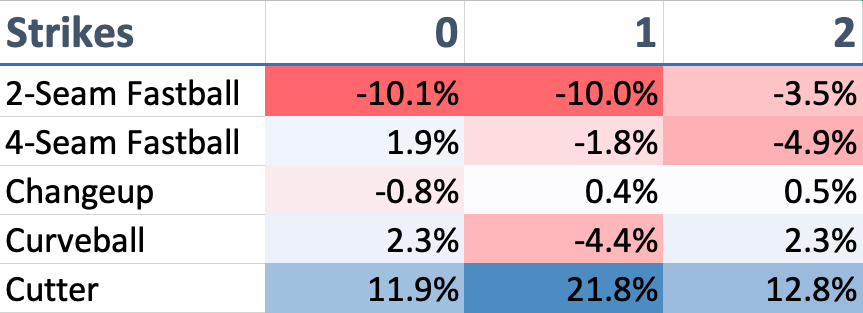
His reduction in 2-seam fastballs has been more drastic earlier in the count, while his usage with 2 strikes hasn’t fallen off quite as much. The integration of his cutter is heavily skewed toward situations with 1 strike. Looking at the raw values, this year he’s thrown it in 25% of counts with 1-strike, compared to about 15% in 0 and 2-strike counts.
In summary, Lance Lynn seems to be doing much better this year, a fact that you might not glean from his ERA, but is evidenced in his FIP. So far, he’s working at a rate that produces a win roughly 20 IP quicker than expected, and some of this seems to be the product of transitioning away from his 2-seam fastball in favor of more 4-seamers and cutters.
This article was first written and submitted to Fangraphs on June 7th, 2019. On June 14th, after Lynn’s next start, I updated the numbers, which are what is reflected on this page. Then on June 20, Craig Edwards of Fangraphs published a very similar piece also analyzing Lance Lynn, and after chatting with some of the people over there, they ran this the next day as a companion, updating the inline numbers with his latest start, but the plots remained the same as shown here. The link for that post can be found here.
Who will win this year’s cup?
Just how lucky have the 18-3 Bruins gotten?
Interoperability is the name of the game
I got a job!
Revisiting some old work, and handling some heteroscadasticity
Using a Bayesian GLM in order to see if a lack of fans translates to a lack of home-field advantage
An analytical solution plus some plots in R (yes, you read that right, R)
okay… I made a small mistake
Creating a practical application for the hit classifier (along with some reflections on the model development)
Diving into resampling to sort out a very imbalanced class problem
Or, ‘how I learned the word pneumonoultramicroscopicsilicovolcanoconiosis’
Amping up the hit outcome model with feature engineering and hyperparameter optimization
Can we classify the outcome of a baseball hit based on the hit kinematics?
A summary of my experience applying to work in MLB Front Offices over the 2019-2020 offseason
Busting out the trusty random number generator
Perhaps we’re being a bit hyperbolic
Revisiting more fake-baseball for 538
A deep-dive into Lance Lynn’s recent dominance
Fresh-off-the-press Higgs results!
How do theoretical players stack up against Joe Dimaggio?
I went to Pittsburgh to talk Higgs
If baseball isn’t random enough, let’s make it into a dice game
Or: how to summarize a PhD’s worth of work in 8 minutes
Double the Higgs, double the fun!
A data-driven summary of the 2018 Reddit /r/Baseball Trade Deadline Game
A 2017 player analysis of Tommy Pham